

AUGUSTA — On April 2, 1987, Rick Fontaine was hanging above the Kennebec River in North Sidney.
Fontaine and a co-worker at the U.S. Geological Survey were trying to capture the river’s peak flow with a rig that consisted of a heavy cable, a reel, a current meter and 200 pounds in weights mounted on an open platform suspended over the river on a cable.
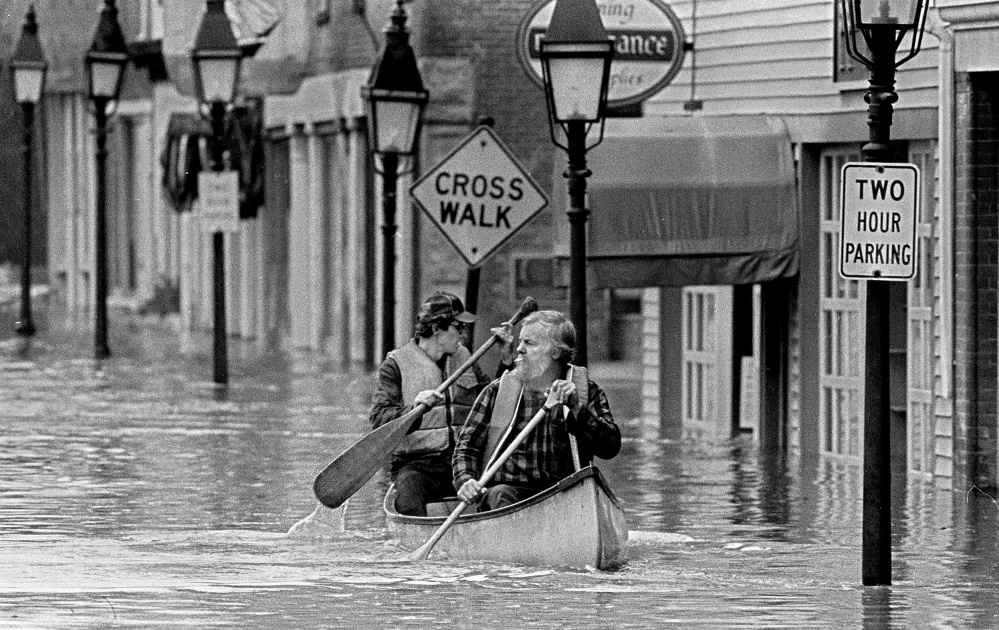

Below them, the Kennebec was swollen with a combination of runoff and snow melt that resulted from heavy rains falling in the last days of March across the nearly 6,000-square-mile watershed in central Maine.
There was also debris.
“We saw two complete houses, intact, floating down the river. Complete houses,” he said. “One of them hit the cable while we were on it. That was pretty scary.”
No one knew it, but by the time the data was compiled and the calculations were completed, the Kennebec River flood of 1987 was the largest measured in Maine’s recorded history, a rare 1,000-year flood. While damages to properties and infrastructure were tallied at what would be more than $210 million today, no lives were lost.
Technology advances have made data gathering during floods less risky, and analyzing that data less time-consuming. But with climate conditions changing, experts can’t say when the next great flood will happen – only that it will.
Sean Birkel, Maine’s state climatologist and a research assistant professor at the Climate Change Institute at the University of Maine, looks at what’s been happening in Maine over time.
“The historical record shows that in the past century, the total amount of precipitation that falls on an annual basis has increased, and more so in the last 15 years,” Birkel said. “And the mode of delivery has changed – we’ve had more extreme rainfall events.”
FINDING THE PATTERN
Forecasting is a risky enterprise. Even with volumes of data, a precise understanding of what will happen in the future is not possible.
“Forecasts are only good for so long,” said Gregory Stewart, the supervisory hydrologist for the U.S. Geographical Survey, in the Maine office of the New England Water Science Center. “Seven to 10 days is about the maximum.”
The U.S. Geological Survey is the federal agency that collects and crunches data about surface water flow in the United States over time. Rivers change over time, and data has to be verified constantly. With that, the agency determines discharge information for rivers that’s used to develop models for what would happen under certain flooding conditions – how high the water would be, what areas would be inundated, and what the impact on bridges, culverts and buildings would be.
But even with enormous data sets and sophisticated models, pinning down the date of the next major flood is still out of reach.
“We have done a lot of trend work for climate change, looking at the past to predict the future,” Stewart said. “The variability between years is so noisy, you cannot make predictions.”
The scientific community is coming to a consensus that the sea level is rising and at what rate it is rising. But that same level of consensus is not possible to reach about river flows, because not enough consistency exists in the data. Part of the problem, Stewart said, is that so many variables are in play.
“We’re a snow-melt dominated system here,” he said.
Measuring the chance of a flood occurring in any given year depends on factors like how much snow has fallen during the winter, how saturated the soil is, and if rain starts falling, how intensely it falls. The agency can create rainfall runoff models and plug in different variables to get an idea of what would happen at warmer or colder temperatures, or with more or less rain falling.
With that, scientists can calculate the annual exceedance probability. It’s a measure of the probability of a flood of a certain magnitude occurring in any given year. Most people know the result of that calculation as a description: 100-year flood, 500-year flood, 1,000-year flood.
What 100-year flood means, Stewart said, is that a 1 in 100 chance exists in any year that a flood of that discharge rate could occur.
For a 500-year flood there is a 1 in 500 chance that a flood of that discharge rate could occur. It’s possible to have floods of that magnitude in successive years or 10 years apart.
And while the calculation can describe what happened, as it did for the 1987 flood, it can’t say when the next one is going to happen.
Birkel is one of the authors of Maine’s Climate Future – 2015 Update. The document, released in April by the Climate Change Institute, reflects what’s changed since the original Maine’s Climate Future – An Initial Assessment was released in 2009.
“The climate is in disequilibrium,” he said, and it’s trying to find its balance. More energy is flowing into earth’s atmosphere than can flow out, and the climate is warming. During the Ice Age, he said, more flowed out than flowed in.
Changes in weather patterns have been observed over the last 100 years. Because the observations of the last couple of decades are so different from those that came before, Birkel said that’s where his focus is. “Probably, it’s the new normal,” he said.
Projections of future climate conditions show that Maine will probably be wetter in coming decades and possibly be subject to more intense storms. If conditions line up as they did in 1987, another major flood could happen.
While the picture isn’t very clear, Stewart said progress is being made. Twenty-five years ago, predictions like the annual Atlantic hurricane forecast that the National Oceanic and Atmospheric Administration issued Thursday weren’t possible.
“The science is getting better,” he said. “In the distant future, we may understand our climate to a greater degree and forecast that out.”
Even with advances in high-performance computing, the capability to consider all the variables and all the conditions that form weather doesn’t exist.
“We can do normal, above normal and below normal, but we can’t do more with some level of accuracy,” he said.
The NOAA forecast predicts that an above-average is most likely this year. The Atlantic hurricane season runs from June 1 through Nov. 30.
RISK AND REWARD
To get to the point where scientists can build models and run scenarios as they do now has required collecting a lot of information over a long time.
And the Kennebec River flood of 1987, later calculated to be a 1,000-year flood, was a rich opportunity with unforeseen problems.
“The challenge for us was to get out and get measurements,” Fontaine said.
Although floods are serious, they tend to be short-lived. The goal is to measure the peak flow, which might not last long. Creeks and streams will peak first, and then the rivers they feed.
Fontaine and a partner headed out to Dover-Foxcroft, where measurements on the Piscataquis River were traditionally taken from the covered bridge. When they arrived, the bridge was gone. By the time they reached the next bridge, water was flowing over its top, and emergency responders had closed it to traffic. Fontaine and his co-worker were turned away.
The cost of missing the live measurement is spending the time and resources needed to make the calculations after the fact. It’s time consuming and it’s not as accurate.
“I can’t even remember all the sites I went to,” he said. “I remember chasing all around getting to stations.”
By the next day, April 2, the peak flows had subsided in streams and tributaries, and the focus was on the Kennebec. Fontaine and a co-worker were tasked with measuring the flow at the North Sidney station.
In the technology of the day, researchers used a platform mounted on a cable system strung between towers on the riverbanks to make flow measurements.
To capture data, they had a rig with a reel, heavy duty cable weighted with 200 pounds to hold the current meter in place. Fontaine said as the meter rotates, it generates an electrical signal. The rotations per measure of time indicate how fast the water is going. These measurements are taken at intervals across a river or stream and plugged into an equation that results in a number that is the river’s discharge.
“The crazy part about how we measured back in those days is that when you are dealing with a big flood like this, there’s a lot of things in the water,” he said. “You can see the floating debris and you can move yourself back and forth on the cable and crank your weight up.”
The hazard comes from the debris you can’t see. “We were snagged on debris that was not visible to us twice, pretty significantly,” he said.
The peak flow at that site was 232,000 cubic feet per second, an immense volume of water.
After the floodwaters subsided, Fontaine and Joseph Nielson compiled a water supply paper for the agency that described the conditions that led to the historic flood.
In the months afterward, the Kennebec was flowing at a very low rate, about 600 cubic feet per second.
Jessica Lowell can be contacted at 621-5632 or at:
jlowell@centralmaine.com
Twitter: @JLowellKJ
Send questions/comments to the editors.

Success. Please wait for the page to reload. If the page does not reload within 5 seconds, please refresh the page.
Enter your email and password to access comments.
Hi, to comment on stories you must . This profile is in addition to your subscription and website login.
Already have a commenting profile? .
Invalid username/password.
Please check your email to confirm and complete your registration.
Only subscribers are eligible to post comments. Please subscribe or login first for digital access. Here’s why.
Use the form below to reset your password. When you've submitted your account email, we will send an email with a reset code.