

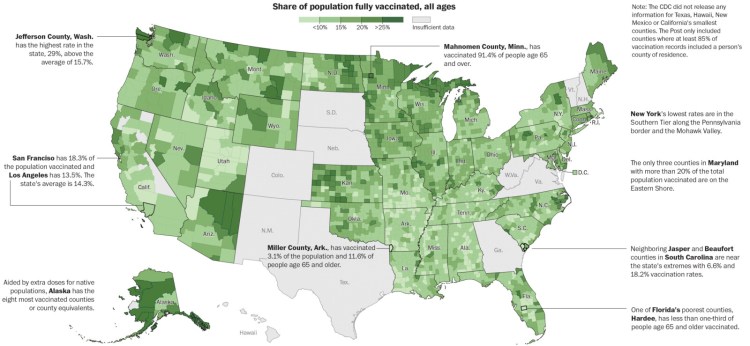
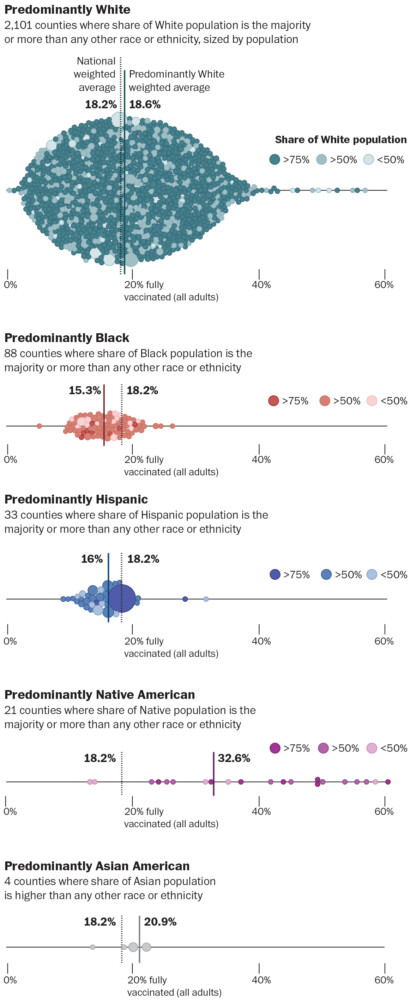
The first nationwide look at vaccination across counties reveals vast differences in the rate that people are receiving protection from the coronavirus, with notably lower rates in predominantly Black areas and counties that voted most heavily for President Donald Trump in 2020.
The data from the Centers for Disease Control and Prevention shows the success in vaccination in Native American areas. In Arizona, for instance, the predominantly Native American counties have at least 35% of adults fully vaccinated while many mostly White or Hispanic counties have fewer than 20%. Alaska also stands out for high vaccination in part because of doses targeted at Alaska Natives living in more than 200 indigenous tribes, who have received additional doses through the Indian Health Service.
The Washington Post
The county data exposes the missing information about who is being protected. Many states are not collecting or sharing basic facts about who is being vaccinated so their information was not released. Data from other states is too spotty to include in the Washington Post analysis.
For the states with usable information, 45% of people age 65 and older, 18.2% of all adults 18 or older, and 14.3% of the entire population are fully vaccinated. The map shows many regions far below the level, however, such as southern Missouri, New York’s Southern Tier and Mohawk Valley, and the coastal region of South Carolina.
The records don’t indicate large differences between urban and rural areas. Major cities, suburbs, smaller cities and rural areas have roughly the same rates for all adults and for adults 65 and older.
METHODOLOGY
The CDC did not release any information for Texas, Hawaii, New Mexico or California’s smallest counties.
The Post is showing only states where data was reported for at least 85% of the people vaccinated. For this reason, Colorado, Georgia, Nebraska, New Hampshire, South Dakota, Vermont, Virginia and West Virginia were excluded from the analysis conducted for this article, including the racial makeup of counties, the urban-rural classification or the presidential vote.
Other than Massachusetts (88%), every other state included information on more than 90% of the recipients. Most states had information on at least 95% of the people vaccinated. The Post did not adjust the vaccination rates to account for the incomplete information, so the county vaccination rates in some states is slightly low due to missing data.
The CDC released information only for people who have complete vaccination protection, meaning two shots of the Pfizer-BioNTech or Moderna vaccines, or one shot of the Johnson & Johnson Janssen vaccine. No information was published about people who have partial vaccination with just one shot of the Moderna or Pfizer-BioNTech vaccines.
For comparisons of areas by racial makeup, The Post classified each county by the majority or plurality racial group according to 2019 Census population estimates. Comparisons were calculated with population-weighted averages and differences reported were statistically significant at the 95% confidence level. White, Black, Asian American and Native American racial groups are for non-Hispanic people. They are distinct from the Hispanic group.
The comparison of rural and urban areas and counties by share of Biden-Trump vote also used population weighted averages. The analysis by presidential voting omits Alaska because results there are summarized in election districts that are different from counties.
Send questions/comments to the editors.

Success. Please wait for the page to reload. If the page does not reload within 5 seconds, please refresh the page.
Enter your email and password to access comments.
Hi, to comment on stories you must . This profile is in addition to your subscription and website login.
Already have a commenting profile? .
Invalid username/password.
Please check your email to confirm and complete your registration.
Only subscribers are eligible to post comments. Please subscribe or login first for digital access. Here’s why.
Use the form below to reset your password. When you've submitted your account email, we will send an email with a reset code.