

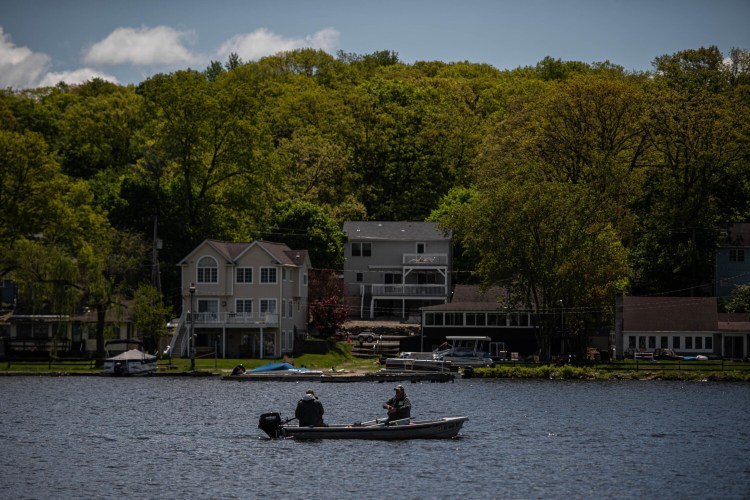
LAKE HOPATCONG, N.J. — Before climate change thawed the winters of New Jersey, this lake hosted boisterous wintertime carnivals. As many as 15,000 skaters took part, and automobile owners would drive onto the thick ice. Thousands watched as local hockey clubs battled one another and the Skate Sailing Association of America held competitions, including one in 1926 that featured 21 iceboats on blades that sailed over a three-mile course.
In those days before widespread refrigeration, workers flocked here to harvest ice. They would carve blocks as much as 2 feet thick, float them to giant ice houses, sprinkle them with sawdust and load them onto rail cars bound for ice boxes in New York City and beyond.
“These winters do not exist anymore,” says Marty Kane, a lawyer and head of the Lake Hopatcong Foundation.
That’s because a century of climbing temperatures has changed the character of the Garden State. The massive ice industry and skate sailing association are but black-and-white photographs at the local museum. And even the hardy souls who still try to take part in ice fishing contests here have had to cancel 11 of the past dozen competitions for fear of straying onto perilously thin ice and tumbling into the frigid water.
New Jersey may seem an unlikely place to measure climate change, but it is one of the fastest-warming states in the nation. Its average temperature has climbed by close to 2 degrees Celsius (3.6 degrees Fahrenheit) since 1895 – double the average for the Lower 48 states.
Over the past two decades, the 2 degrees Celsius number has emerged as a critical threshold for global warming. In the 2015 Paris accord, international leaders agreed that the world should act urgently to keep the Earth’s average temperature increases “well below” 2 degrees Celsius by the year 2100 to avoid a host of catastrophic changes.
The potential consequences are daunting. The United Nations Intergovernmental Panel on Climate Change warns that if Earth heats up by an average of 2 degrees Celsius, virtually all the world’s coral reefs will die; retreating ice sheets in Greenland and Antarctica could unleash massive sea level rise; and summertime Arctic sea ice, a shield against further warming, would begin to disappear.
But global warming does not heat the world evenly.
A Washington Post analysis of more than a century of National Oceanic and Atmospheric Administration temperature data across the Lower 48 states and 3,107 counties has found that major areas are nearing or have already crossed the 2-degree Celsius mark.
• Today, more than 1 in 10 Americans – 34 million people – are living in rapidly heating regions, including New York City and Los Angeles. Seventy-one counties have already hit the 2-degree Celsius mark.
• Alaska is the fastest-warming state in the country, but Rhode Island is the first state in the Lower 48 whose average temperature rise has eclipsed 2 degrees Celsius. Other parts of the Northeast – New Jersey, Connecticut, Maine and Massachusetts – trail close behind.
• While many people associate global warming with summer’s melting glaciers, forest fires and disastrous flooding, it is higher winter temperatures that have made New Jersey and nearby Rhode Island the fastest-warming of the Lower 48 states.
The average New Jersey temperature from December through February now exceeds 0 degrees Celsius (32 degrees Fahrenheit), the temperature at which water freezes. That threshold, reached over the past three decades, has meant lakes don’t freeze as often, snow melts more quickly, and insects and pests don’t die as they once did in the harsher cold.
The freezing point “is the most critical threshold among all temperatures,” said David A. Robinson, New Jersey state climatologist and professor at Rutgers University’s department of geography.
The Washington Post
The uneven rise in temperatures across the United States matches what is happening around the world.
In the past century, the Earth has warmed 1 degree Celsius (1.8 degrees Fahrenheit). But that’s just an average. Some parts of the globe – including the mountains of Romania and the steppes of Mongolia – have registered increases twice as large. It has taken decades or in some cases a century. But for huge swaths of the planet, climate change is a present-tense reality, not one looming ominously in the distant future.
To find the world’s 2C hot spots, its fastest-warming places, The Post analyzed temperature databases, including those kept by NASA and NOAA; peer-reviewed scientific studies; and reports by local climatologists. The global data sets draw upon thousands of land-based weather stations and other measurements, such as ocean buoys armed with sensors and ship logs dating as far back as 1850.
In any one geographic location, 2 degrees Celsius may not represent global cataclysmic change, but it can threaten ecosystems, change landscapes and upend livelihoods and cultures.
In Lake Hopatcong, thinning ice let loose waves of aquatic weeds that ordinarily die in the cold. This year, a new blow: Following one of the warmest springs of the past century, harmful bacteria known as blue-green algae bloomed in the lake just as the tourist season was taking off in June.
New Jersey’s largest lake was shut down after the state’s environmental agency warned against swimming or fishing “for weeks, if not longer.”
The nation’s hot spots will get worse, absent a global plan to slash emissions of the greenhouse gases fueling climate change. By the time the impacts are fully recognized, the change may be irreversible.
Daniel Pauly, an influential marine scientist at the University of British Columbia, says the 2-degree Celsius hot spots are early warning sirens of a climate shift.
“Basically,” he said, “these hot spots are chunks of the future in the present.”
NATIONWIDE TRENDS
Nationwide, trends are clear. Starting in the late 1800s, U.S. temperatures began to rise and continued slowly up through the 1930s. The nation then cooled slightly for several decades. But starting around 1970, temperatures rose steeply.
At the county level, the data reveals isolated 2-degree Celsius clusters: high-altitude deserts in Oregon; stretches of the western Rocky Mountains that feed the Colorado River; a clutch of counties along the northeastern shore of Lake Michigan – home to the famed Sleeping Bear Dunes National Lakeshore near Traverse City.
Along the Canadian border, a string of counties from eastern Montana to Minnesota are quickly heating up.
The topography of warming varies. It is intense at some high elevations, such as in Utah and Colorado, and along some highly populated coasts: Temperatures have risen by 2C in Los Angeles and three neighboring counties. New York City is also warming rapidly, and so are the very different areas around it, such as the beach resorts in the Hamptons and leafy Westchester County.
The smaller the area, the more difficult it is to pinpoint the cause of warming. Urban heat effects, changing air pollution levels, ocean currents, events like the Dust Bowl, and natural climate wobbles such as El Niño could all be playing some role, experts say.
The only part of the United States that has not warmed significantly since the late 1800s is the South, especially Mississippi and Alabama, where data in some cases shows modest cooling. Scientists have attributed this “warming hole” to atmospheric cycles driven by the Pacific and Atlantic oceans, along with particles of soot from smokestacks and tailpipes, which have damaging health effects but can block some of the sun’s intensity. Those types of pollutants were curtailed by environmental policies, while carbon dioxide remained unregulated for decades.
Since the 1960s, however, the region’s temperatures have been increasing along with the rest of the country’s.
The Northeast is warming especially fast.
Anthony Broccoli, a climate scientist at Rutgers, defines an unusually warm or cold month as ranking among the five most extreme in the record going back to the late 1800s. In the case of New Jersey, he says, “since 2000, we’ve had 39 months that were unusually warm and zero that were unusually cold.”
Scientists do not completely understand the Northeast hot spot. But fading winters and very warm water offshore are the most likely culprits, experts say. That’s because climate change is a cycle that feeds on itself.
Warmer winters mean less ice and snow cover. Normally, ice and snow reflect solar radiation back into space, keeping the planet relatively cool. But as the ice and snow retreat, the ground absorbs the solar radiation and warms.
NOAA data shows that in every Northeast state except Pennsylvania, the temperatures of the winter months of December through February have risen by 2 degrees Celsius since 1895-1896. And U.S. Geological Survey data shows that ice breaks up in New England lakes nine to 16 days earlier than in the 19th century.
This doesn’t mean the states can’t have extreme winters anymore. Polar vortex events, in which frigid Arctic air descends into the heart of the country, can still bring biting cold. But the overall trend remains the same and is set to continue. One recent study found that by the time the entire globe crosses 2 degrees Celsius, the Northeast can expect to have risen by about 3 degrees Celsius (5.4 degrees Fahrenheit), with winter temperatures higher still.
HAVOC PLAYS OUT DIFFERENTLY
Climate change plays havoc differently in different places.
In Rhode Island, Narragansett Bay has warmed as much as 1.6 degrees Celsius (2.9 degrees Fahrenheit) in the past 50 years, and for want of cooler water, the state’s lobster catch has plummeted 75% in the past two decades.
Along the shoreline, the hotter and higher sea is shuffling the lineup of oceanfront homes.
Roy Carpenter’s Beach is a collection of summer cottages along a quarter-mile stretch that is eroding faster than any other part of the state – an average of 3.3 feet a year.
Rob Thoresen’s great-grandfather bought the property nearly a century ago, and residents living in 377 cottages there now lease the land from the family business.
About a decade ago, the family tried – in vain – to persuade residents to move away from the encroaching ocean. Their reluctance was no surprise; the back of the property features a view of cornfields.
But then the coast took an indirect hit from Hurricane Sandy. It damaged 11 homes in the community’s front row, with three of them washing out to sea. The surf laps over the remains of concrete foundations and wooden pylons, knocking over construction fences.
In 2013, 28 families in the first and second rows started moving to the back of the development – roughly 1,000 feet away. The community is planning to move another 20 houses.
It is expensive. Homeowners pay to physically move their cottages or demolish them and rebuild. Matunuck Beach Properties, the management company, must survey the properties and prepare new locations, laying out new roads and sewer pipes.
Tony Loura, who has summered in Roy Carpenter’s Beach for 15 years, is philosophical about his predicament. He is on the fourth row, where he has an unobstructed view of the ocean from his rocking chair. He estimates that he used to be 1,000 feet from the water. Now, the ocean is only about 150 feet away.
“I’m hoping that I’m back far enough that I won’t have to move to the back,” said Loura, 66. “Every time they say there’s a storm, I get worried.”
With 420 miles of coastline, Rhode Island is particularly vulnerable to the vagaries of the Gulf Stream, a massive warm current that travels up the East Coast from the Gulf of Mexico before making a right turn toward Greenland and Europe.
The Gulf Stream is enormous, encompassing more water than “all of the world’s rivers combined,” according to NOAA. It is one part of an even larger global “conveyor belt” of currents that transport heat around the world.
A slowing of these currents, which scientists think is caused by the melting of Arctic ice, has pushed the Gulf Stream closer to the East Coast, bringing more warm water and, perhaps, hotter temperatures onshore. Offshore, it has become its own hot spot, helping to boost water temperatures by 2 degrees Celsius or more in some regions.
If the slowing continues, seas could rise farther and faster. That’s because when the current slows, water it was driving toward Europe drifts back across the Atlantic to the U.S. coastline. Scientists are trying to determine whether the Gulf Stream is already contributing to rapid sea level rise on the East Coast.
Tidal gauges show sea levels have risen roughly nine inches since 1930, and researchers at the University of Rhode Island have determined that the rate has quickened by about a third in recent years.
By 2030, sea level rise will flood 605 buildings six times a year, according to the Rhode Island Coastal Resources Management Council’s executive director, Grover Fugate.
Roy Carpenter’s Beach is especially vulnerable.
Some residents want the beach’s owners to fight off the sea, Loura said.
“They think they should build a sea wall, they should bring in tons of sand,” he said. “Last year, they spent a lot of money on sand. Guess what? It’s all gone.”
Thoresen’s family is moving a convenience store and office for the second time in a decade – this time all the way back to the 18th row.
“We moved it back 100 feet, and it only bought us 10 years,” Thoresen said. “That’s crazy.”
That’s what people who live in 2-degree Celsius zones are discovering: that climate change seems remote or invisible, until all of a sudden it is inescapable.
RECALLING WHEN THE LAKE FROZE
Here at Lake Hopatcong, Tim Clancy, 65, a ruddy-faced fisherman and retiree, has helped run the annual ice fishing contests for years. He has a photo of himself taken in 2015, standing in the middle of the frozen lake, a string of four perch dangling from one hand, his 400-pound all-terrain buggy parked on the ice behind him.
“It was like a tailgate party. Midnight madness. People camped out with their snowmobiles,” he says. “But the ice is not safe anymore.”
At the Lake Hopatcong Foundation offices, director Kane recalls that the lake used to freeze over by Thanksgiving and now rarely does so before January.
According to records kept by the local Knee Deep Club, a fishing group, 26 fishing contests were canceled because of poor ice conditions from 1998 through 2019. Only 19 were held successfully.
Nine miles long, Lake Hopatcong sits between two counties – Sussex and Morris – in the state’s northwest. Both have been warming fast, especially in winter. According to The Post’s review of New Jersey data, winter temperatures in Sussex have increased 2.6 degrees Celsius (4.7 degrees Fahrenheit) since the winter of 1895-1896. For Morris, the winter increase has been slightly sharper 2.7 degrees Celsius (4.9 degrees Fahrenheit).
Robinson, the state climatologist, found that January temperatures in Sussex County generally need to average around minus-3.9 to minus-3.3 Celsius (25 to 26 degrees Fahrenheit) for successful ice fishing.
Instead, average winter temperatures are moving closer to the freezing point, with some winters now exceeding 0 degrees Celsius (32 degrees Fahrenheit).
It is not just the lake that is being wracked by climate changes.
From the Jersey Shore to the shopping malls of Paramus, from hiking trails in the northwest to the Bayway oil refinery, the state faces exceptionally heavy and unpredictable rainfall – even for New Jersey. Last year, it was inundated by a record 64.77 inches of rainfall statewide, 40% above average.
Pests, no longer eradicated by cold winters, are attacking people, crops and landscapes alike.
The 1/8-inch-long southern pine beetle had been largely confined to southern U.S. forests – hence its name. But the warmer temperatures have spurred the beetle’s migration north, where it has damaged more than 20,000 acres of the state’s Pine Barrens, a vast coastal forested plain that Congress has defined as a national reserve.
“They are changing the Pinelands,” says Matthew Ayres, a Dartmouth researcher who has studied the beetle. “It may not be too long before people are driving through the Pinelands saying, ‘Why do they call it the Pinelands?'”
Mosquitoes, once dubbed on postcards as New Jersey’s “air force,” have longer seasons. The Warren County Mosquito Control Commission, whose records date to 1987, uses fixed-wing aircraft to drop a granular, naturally occurring soil microbe on swamps to kill the mosquito larvae.
But the bugs may be winning the air war. The commission’s flights are more frequent, and the past eight years, led by 2018, have had the highest numbers of acres treated annually. Mosquitoes carrying West Nile virus came up from the South 20 years ago. Last year, Warren became the last county in the state to register human cases of the disease.
“Mosquito season used to start on June 1 and end on Sept. 30,” said Rutgers professor Dina Fonseca, an expert on insect-borne disease. But unless the air war starts earlier in the spring, “you’re not going to address the mosquito problem.”
‘IT’S ALMOST PUT US OUT OF BUSINESS’
On a cool but sunny day in May, Fred Lubnow, director of aquatic programs at Princeton Hydro, and Katie Walston, a senior scientist there, pulled up their anchor in Lake Hopatcong to find it covered with aquatic weeds. The culprit? Fertilizer runoff combined with winters too warm to kill them off.
“The plants start growing earlier and linger around longer, as well,” Lubnow said. The thick ice blocked sunlight from nurturing the weeds. But “in some of these shallow areas, as early as February, we’re looking through the ice seeing the plants growing.”
By summer, the weeds become a nuisance, forcing the state government to “harvest” them with large paddles and toss them onto a conveyor belt, then onto barges. Some years, funding has been hard to get, delaying harvesting and angering homeowners.
“If this area is not harvested, you can’t get a boat through it,” Lubnow says. Swimming isn’t possible, either. Fishing becomes difficult.
In late June, disaster struck.
The New Jersey Department of Environmental Protection detected toxic bacteria known as blue-green algae. Aerial photos showed the telltale large streaks of “pea soup” across the lake. The agency urged people to avoid swimming, wading and watersport activities such as jet-skiing, kayaking, windsurfing and paddleboarding.
“It’s almost put us out of business,” says John Clark, co-owner of Little Nicki’s Italian restaurant, which looks out onto the lake. Little Nicki’s does nearly a tenth of its business over the first two weekends in July and is usually jammed the afternoon before July 4. Yet there were only three people there that day. Clark estimated that business was down by half.
“It’s completely dead. Everyone was having a banner year. Then you hit a wall.”
How we analyzed the data
To analyze warming temperatures in the United States, The Washington Post used the National Oceanic and Atmospheric Administration’s Climate Divisional Database (nClimDiv), which provides monthly temperature data at the national, state and county level between 1895 and 2018 for the Lower 48 states. NOAA does not provide this data for Hawaii, and its data for Alaska begins in 1925.
We calculated annual mean temperature trends in each state and county in the Lower 48 states using linear regression – analyzing both annual average temperatures and temperatures for the three-month winter season (December, January and February). While not the only approach for analyzing temperature changes over time, this is a widely used method.
County population numbers are the U.S. Census Bureau’s estimate of resident total population for July 2018.
Annual temperature averages in the interactive county feature are displayed as departures from the 1895-2018 average temperature for each county. These departures from the average are referred to as “temperature anomalies” by climate scientists.
To make the maps, we applied the same linear regression method for annual average temperatures to NOAA’s Gridded 5km GHCN-Daily Temperature and Precipitation Dataset (nClimGrid), which is the basis for nClimDiv. For mapping purposes, the resolution of the data was increased using bilinear interpolation.
The warming of Alaska was treated separately, after consulting with Rick Thoman, an expert on the state’s climate at the University of Alaska at Fairbanks. Thoman said that a linear trend does not apply in the case of this state because the warming has been so extreme in the most recent years – something that such a trend would understate. So Thoman used a smoothed curve to plot Alaska’s warming trend, calculating about 2.2 degrees Celsius (4 degrees Fahrenheit) just since 1925.
Kenneth Kunkel of the North Carolina Institute for Climate Studies, who developed climate analyses for all 50 U.S. states during the 2013 National Climate Assessment, provided an initial analysis of the Lower 48 states’ temperature trends from 1895 through 2018 at The Post’s request.
– – –
Link to The Post’s interactive, searchable graphic: https://www.washingtonpost.com/graphics/2019/national/climate-environment/climate-change-america/
climate-repeat
Send questions/comments to the editors.

Success. Please wait for the page to reload. If the page does not reload within 5 seconds, please refresh the page.
Enter your email and password to access comments.
Hi, to comment on stories you must . This profile is in addition to your subscription and website login.
Already have a commenting profile? .
Invalid username/password.
Please check your email to confirm and complete your registration.
Only subscribers are eligible to post comments. Please subscribe or login first for digital access. Here’s why.
Use the form below to reset your password. When you've submitted your account email, we will send an email with a reset code.