


Some of the work on display now at “A Pageant of Spectacles: Chromolithography in America” at The Osher Map Library and Smith Center for Cartographic Education in Portland. Ben McCanna/Staff Photographer
Chromolithography, despite sounding like something only a science professor would understand, is sometimes called the democratic art.
That’s because, in the latter half of the 1800s, the color printing process helped bring vivid, life-like color and realistic detail to people all over the world in the form of maps, posters and tourist advertisements. Before the process was in wide use, most maps and posters were black and white or hand-colored, but not very eye-catching.
Chromolithography was sort of the HD or IMAX of its time.
“It was used to create an illusion of realism, to show spectacles,” said Matthew Edney, Osher Chair in the History of Cartography at the University of Southern Maine. “Before chromo, that wasn’t possible in the same way.”
Examples of what chromolithography was used for and how it transformed maps and geographic images are on display now as part of “A Pageant of Spectacles: Chromolithography in America” at the Osher Map Library and Smith Center for Cartographic Education on the USM campus in Portland. It’s on view through June 29.
Matthew Edney, Osher Professor in the History of Cartography at the Osher Map Library and Smith Center for Cartographic Education at University of Southern Maine, discusses the maps on display now. Ben McCanna/Staff Photographer
More than 90 pieces are on display, including battlefield maps that were designed to give people nearly real-time information on the Civil War; tourism posters featuring bird’s-eye views of Mount Washington, Casco Bay and the Chicago World’s Fair of 1893; maps of the world and various geographic regions used in schools; and games, trading cards and advertisements.
In the 1800s, maps and images made with chromolithography adorned classrooms, were sold by subscription to people wanting to learn about their world and were used to create tourist maps for a huge variety of places and attractions.
A CENTER OF THE MAP HISTORY SCENE
The Osher Map Library and Smith Center for Cartographic Education includes more than half a million items in its collection, and more than 75,000 are available to view online. The current exhibit helps illustrate why the library is considered one of the top map libraries in the country, because of the size and variety of its collection and its continued commitment to educating the public.
“With maps, atlases and globes ranging from the 15th century to the present, their ever-growing collections are crucial for preservation and access to the rich history of maps and mapping throughout the world,” said David Weimer, director of the Smith Center for the History of Cartography and Robert A. Holland Curator of Maps at the Newberry Library in Chicago. “With this collection, their team consistently models what great map education can do and produces inspiring and thought-provoking exhibitions. ”
Weimer said the Portland map library and education center holds “one of the most important map collections in North America.”
The title page to Yaggy’s Geographical Study (1887), a collection of maps, charts and diagrams used in classrooms. Photo courtesy of the Osher Map Library and Smith Center for Cartographic Education, University of Southern Maine.
The exhibit on chromolithography is being dedicated to Harold Osher, a Portland physician, philanthropist and map collector who died Dec. 23 at the age of 99.
The Osher Map Library and Smith Center for Cartographic Education gets its name from the two families that were cornerstones of its founding. In 1986, Eleanor Houston Smith donated a collection of maps, atlases and globes in memory of her late husband, Lawrence M.C. Smith, to USM. Lawrence Smith had served in the administration of President Franklin Roosevelt.
In 1989, Harold Osher and his wife, Peggy Osher, donated their map collection to USM. Harold Osher was the former director of cardiology at Maine Medical Center who began collecting around 1975, in London. In 2018, he formally turned over his and his wife’s entire collection – loosely valued at $100 million – to the Osher Map Library, as well as an undisclosed amount of cash to supplement what was then a $3 million endowment for the library.
With the two collections in hand, the library and education center opened at USM in 1994.
“Dr. Osher was particularly fond of chromolithography and had some spectacular examples,” said Libby Bischof, executive director of the Osher Map Library and Smith Center for Cartographic Education.
“Birds-Eye View from Summit of Mt. Washington, White Mountains, New Hampshire ” was created by Geo. H. Walker for the Passenger Department, Boston & Maine Railroad, in 1902. Photo courtesy of the Osher Map Library and Smith Center for Cartographic Education, University of Southern Maine.
CATCHING THE EYE
Chromolithography caught on as a process because it gave a more naturalistic look to images than hand-coloring, one without all the black bounding lines around every object, Edney said. The process involves creating an image on a stone, usually with a grease-based crayon or ink. The image is then covered in a chemical solution so the ink takes hold. Each image is created by using multiple stones, one for each color, which allows for vivid colors and fine detail.
The works in “A Pageant of Spectacles” have in common their ability to catch the eye, and especially did in the days before color photography, TV or movies.
One of the works on display is a dramatic “bird’s-eye view” of Mount Washington, created in 1902 as a way to attract riders on the Boston and Maine Railroad. It shows the summit house on top of the mountain in great detail, surrounded by the brightly colored topography of the surrounding peaks.
Bird’s-eye views became popular in the late 1800s and early 1900s as a way to give people a more dramatic view of something, Bischof said, especially since there was no easy way for people to actually get that view in real life. Artists often did bird’s-eye views of cities by walking the streets and making sketches, and then looking at a map or plan of the city to get the basic layout and geography.
Some of the other aerial or bird’s-eye views in the exhibit include: a 1913 image of Civil War battlefields around Chattanooga, Tennessee, created for the Chattanooga Railway and Light Company; an aerial view of Massachusetts, Connecticut and Rhode Island done for the Joy Steamship Co. in 1905; a bird’s-eye view of the World’s Columbian Exhibition (World’s Fair) in Chicago in 1893; and a bird’s-eye view of Casco Bay and surrounding areas, done for the Maine Central Railroad in 1906.
There are also several aerial views of Civil War images, depicting battlefields and areas of strategic importance. Many were created and sold during the war so that people could follow the war’s events in much more detail – and color – than they could in newspapers, Edney said. One of these is a view of the battlefield at Gettysburg while another is called “Panorama of the Seat of War” and is a combination of three separately published views showing the Atlantic coast from Florida to Delaware.
“It (chromolithography) was used to create these particular landscapes at moments that lend themselves to more realism and more detail,” said Edney. “People could look at something like this and say, ‘This is where my son died.’ ”
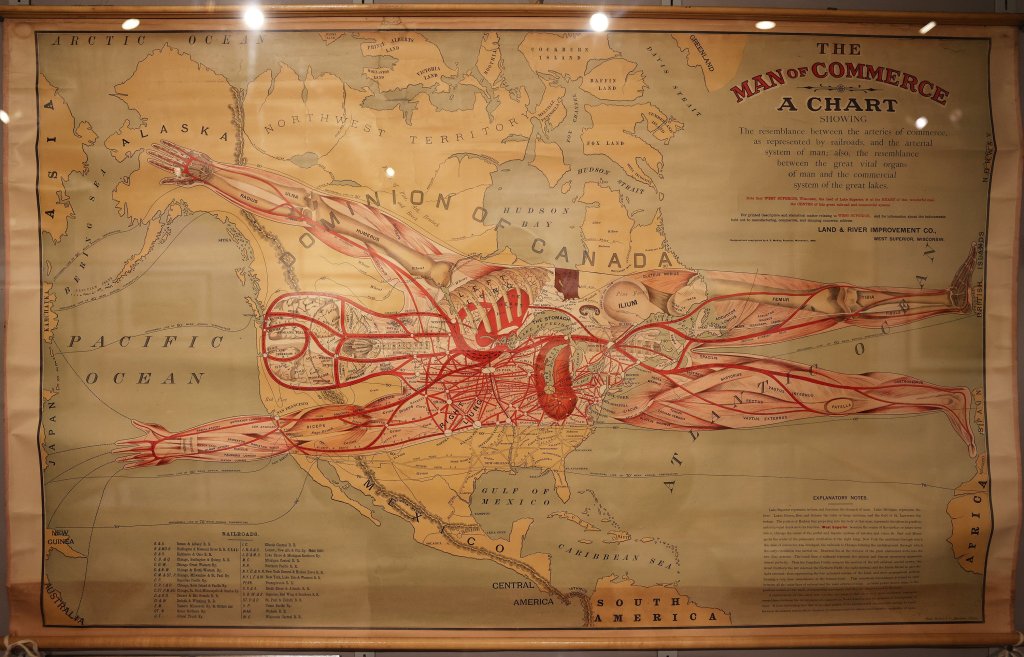
This 1889 chart – an example of anatomical mapping – shows the human arterial system superimposed over a map of North America, showing the town of West Superior, Wis., as the heart of commerce. Ben McCanna/Staff Photographer
But the color and vividness of chromolithography could also be used for much lighter projects, including tourist maps, board games or trading cards. One of the more unusual items in the exhibit is a large promotional wall map showing that the town of West Superior, Wisconsin, is the literal heart of commerce in North America and the world beyond. It was created, you might be surprised to know, for the Land and River Improvement Co. of West Superior, Wisconsin, in 1889.
It’s an anatomical map called “The Man of Commerce,” showing a human physique – complete with organs and muscles and arteries – superimposed over a map of the United States and Canada. The red heart of the human is covering West Superior.
“It’s certainly one of the funnier ones, but it’s still being used as a point of spectacle,” Edney said.
Copy the Story LinkSend questions/comments to the editors.

Success. Please wait for the page to reload. If the page does not reload within 5 seconds, please refresh the page.
Enter your email and password to access comments.
Hi, to comment on stories you must . This profile is in addition to your subscription and website login.
Already have a commenting profile? .
Invalid username/password.
Please check your email to confirm and complete your registration.
Only subscribers are eligible to post comments. Please subscribe or login first for digital access. Here’s why.
Use the form below to reset your password. When you've submitted your account email, we will send an email with a reset code.